Dev Tools
Radon IDE comes with support for launching Dev Tools as separate panels within VSCode or Cursor.
The built-in tools for Network Inspector, Redux, Outline Renders (via react-scan) and React Query are integrated with the IDE and don't require any additional configuration.
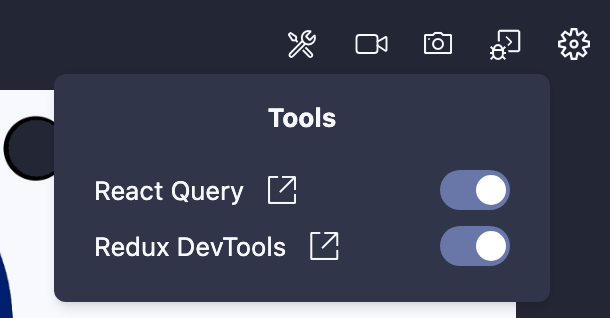
When the IDE detects that a specific tool is available and configured properly (see below for details on configuring individual tools), it will be listed in the tools menu where you can turn it on and off:
When the tool is enabled in your project, you will get a new panel opened in VSCode:
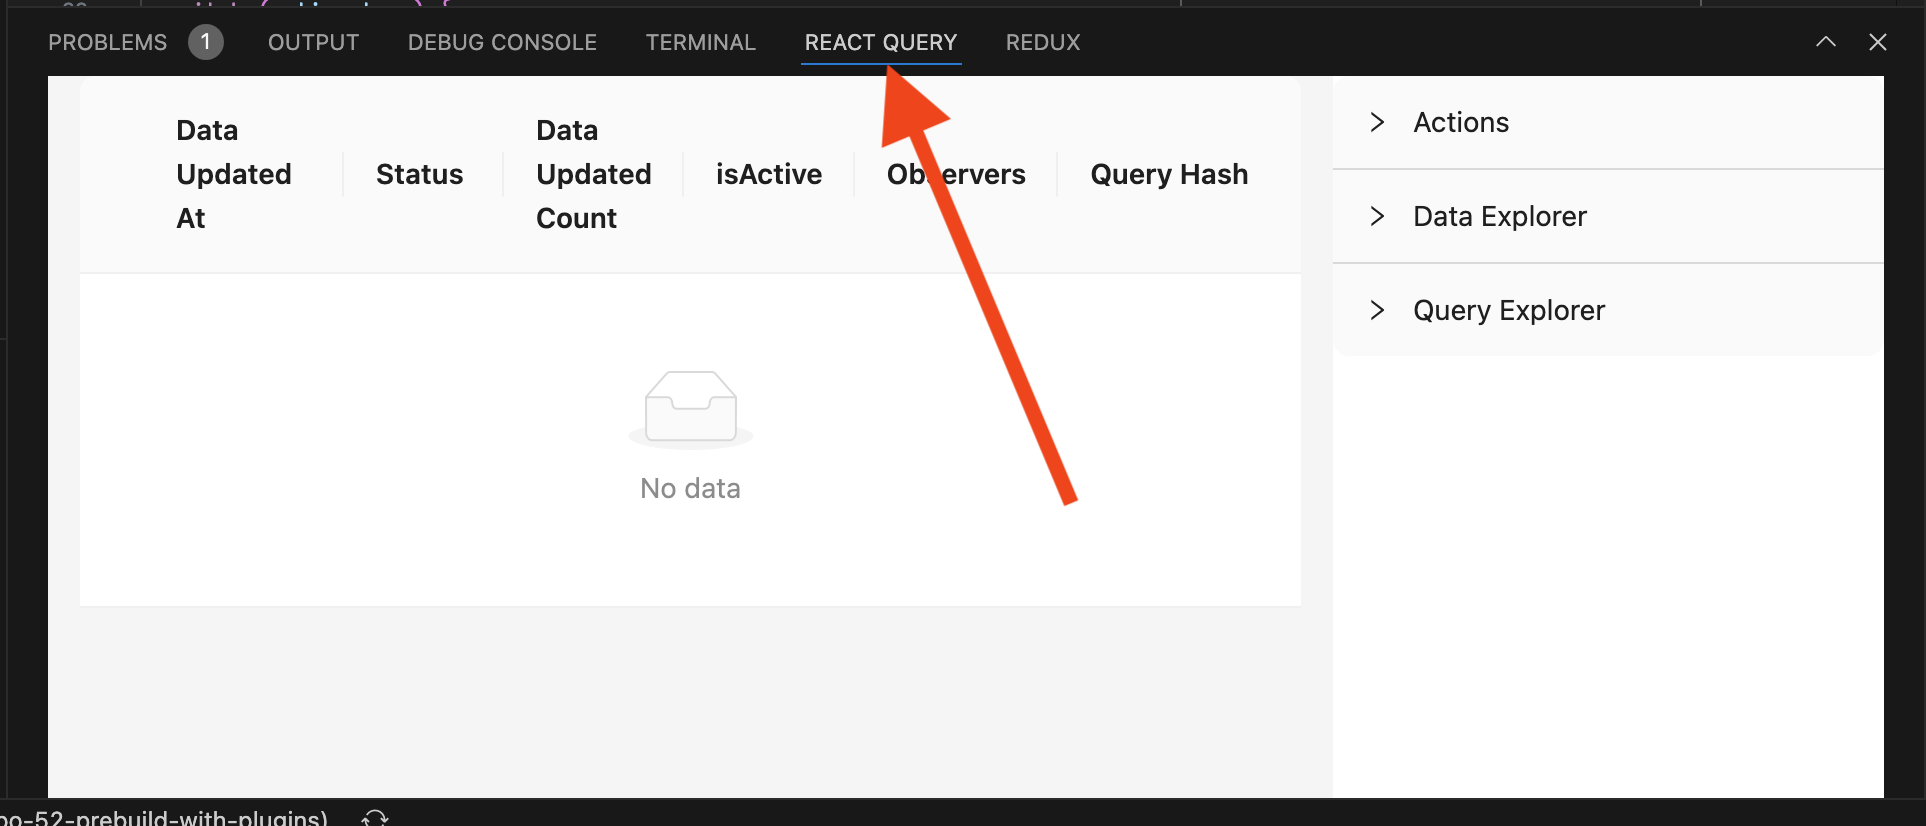
There will be a separate panel for each individual tool. You can quickly navigate to the panel from the tools menu by using the "link" icon next to the tool name:
Tool on/off setting is persisted locally for the scope of your project (VSCode or Cursor workspace). Therefore when you open the project next time in the IDE, the tool panel will launch automatically. It will also be kept open when you switch between different devices across that project.
Redux Toolkit
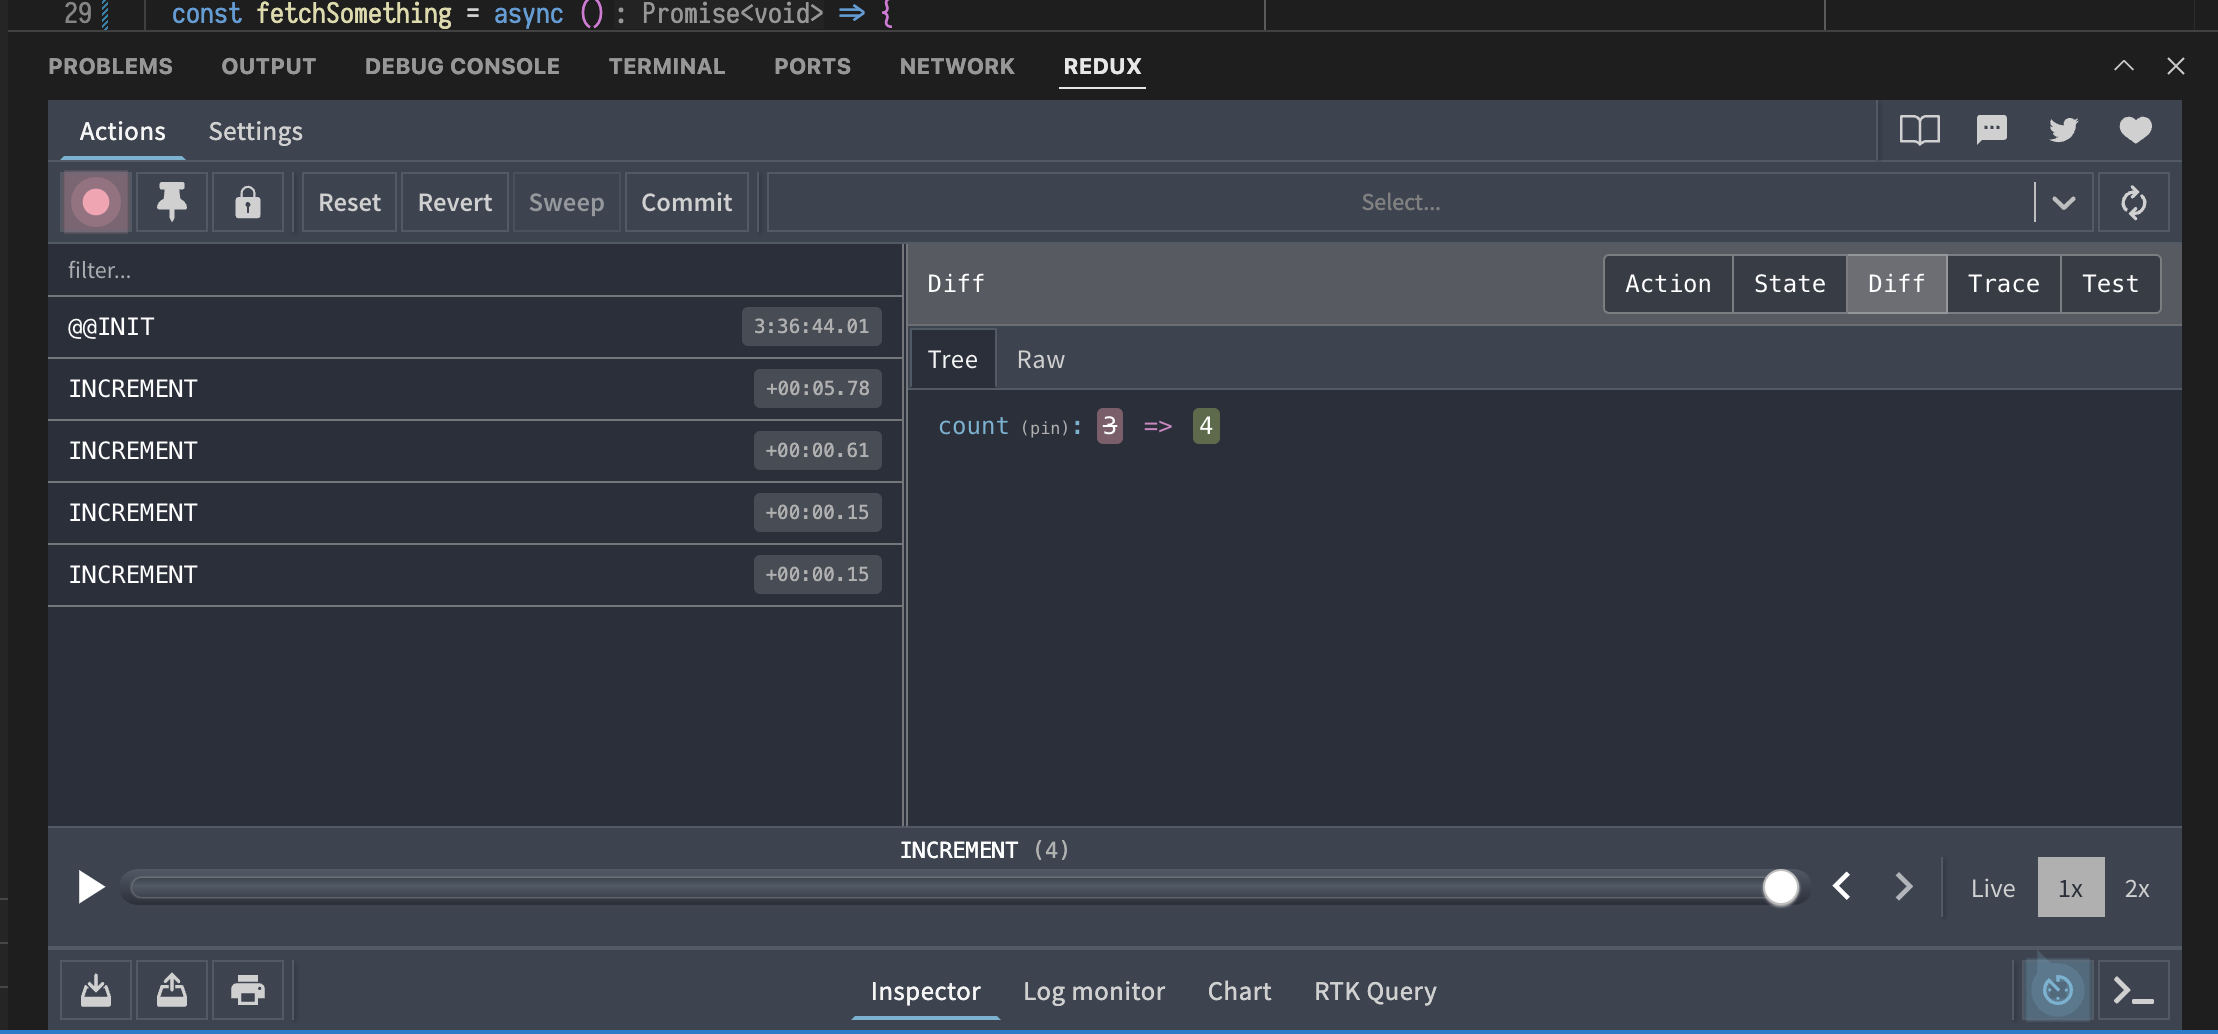
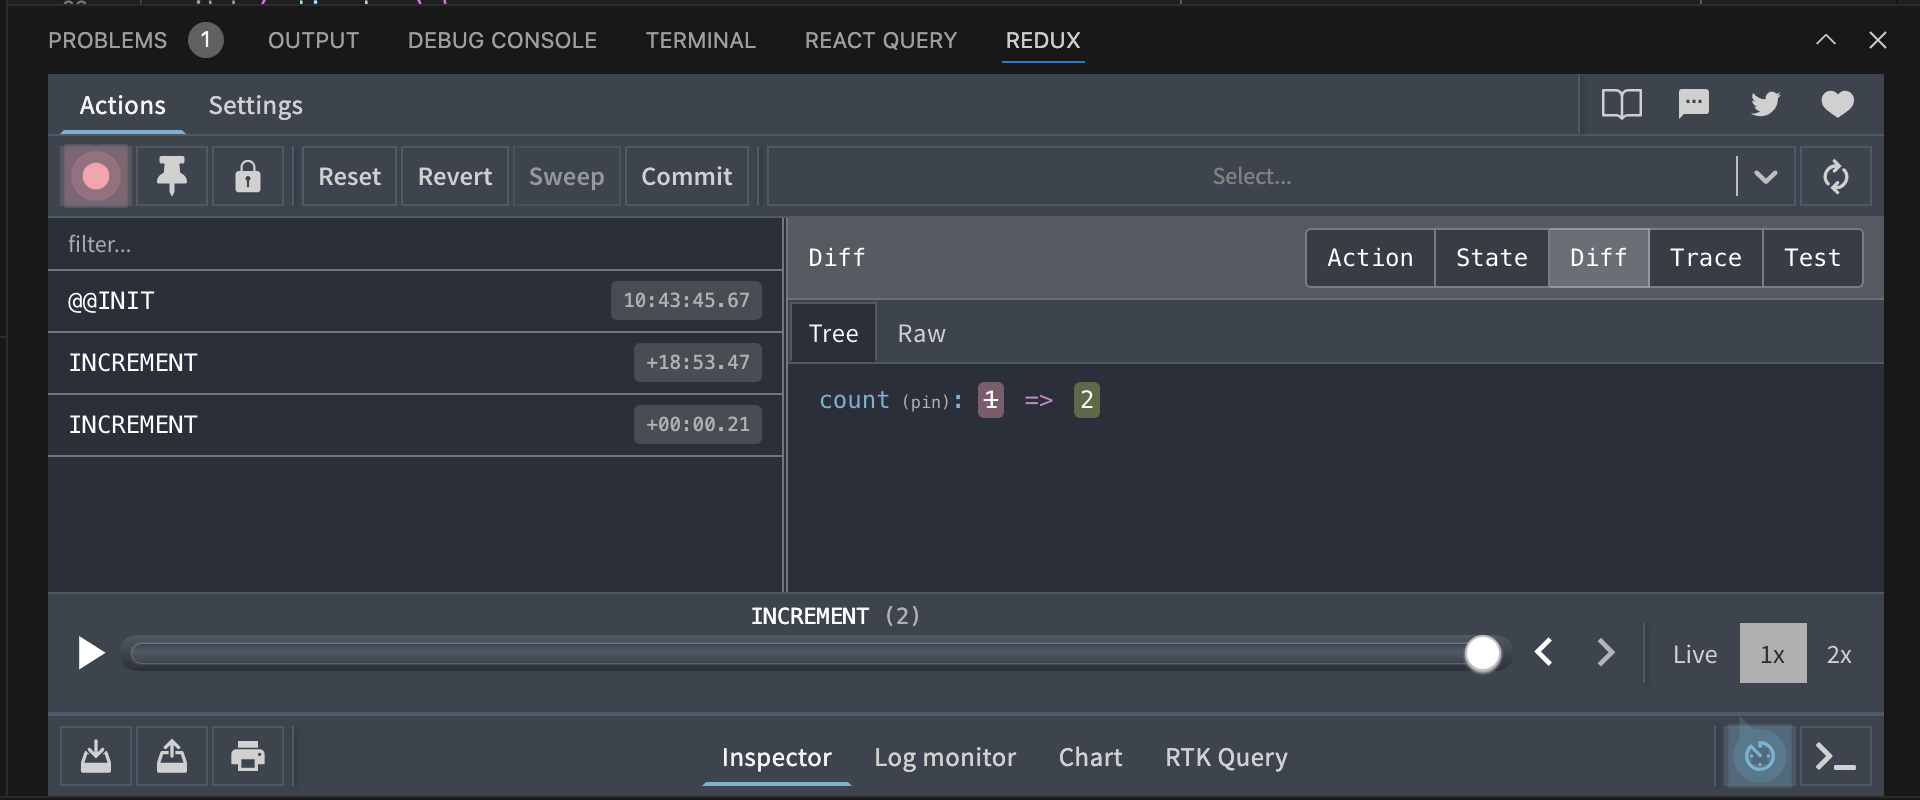
This plugin doesn't require any additional configuration. If your app uses Redux Toolkit, the IDE will automatically detect that, and Redux plugin will be listed in the Dev Tools menu where you can enable it. Once enabled you will be able to use the official Redux UI (same one as the Redux Chrome extension) from within your editor panel:
React Query
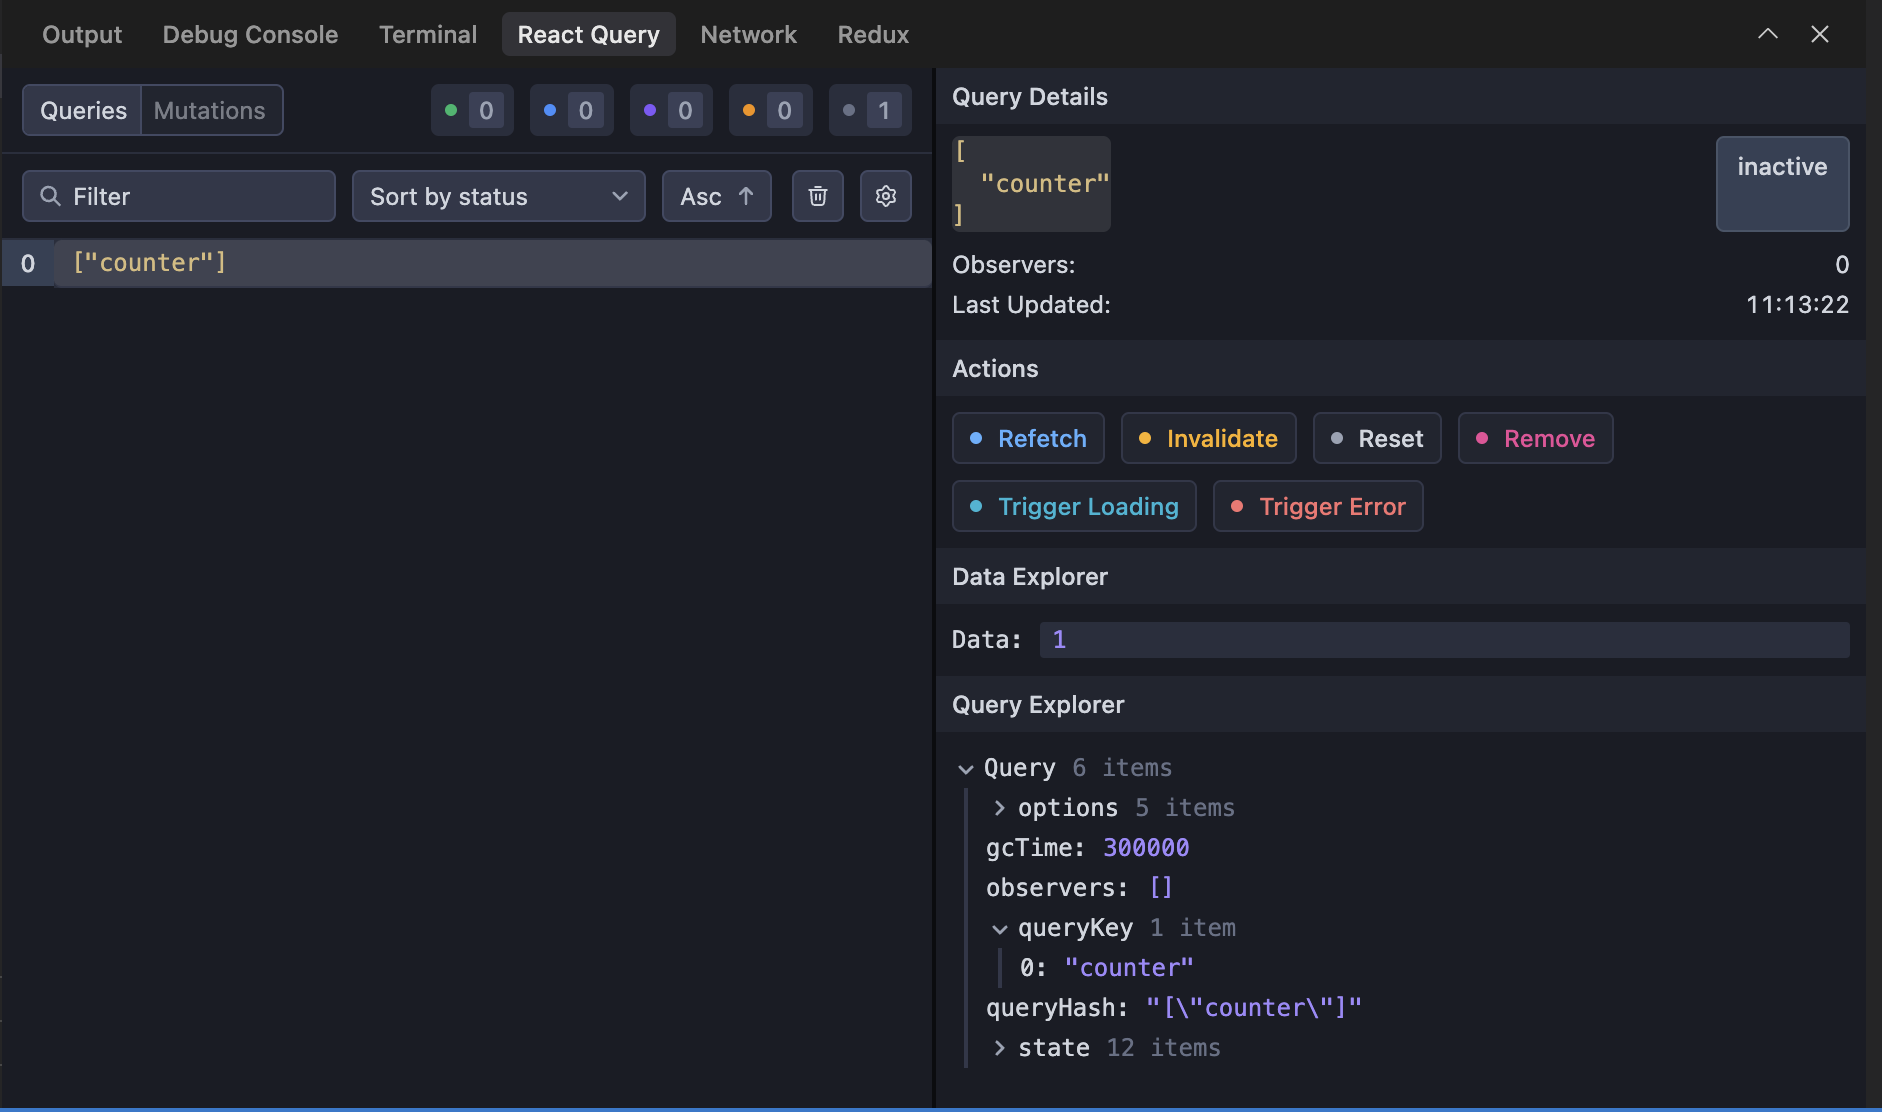
This plugin doesn't require any additional configuration. When the IDE detects your app uses React Query, the plugin will be listed in the Dev Tools menu. Once enabled you can use the official React Query's devtool UI from within the editor panel:
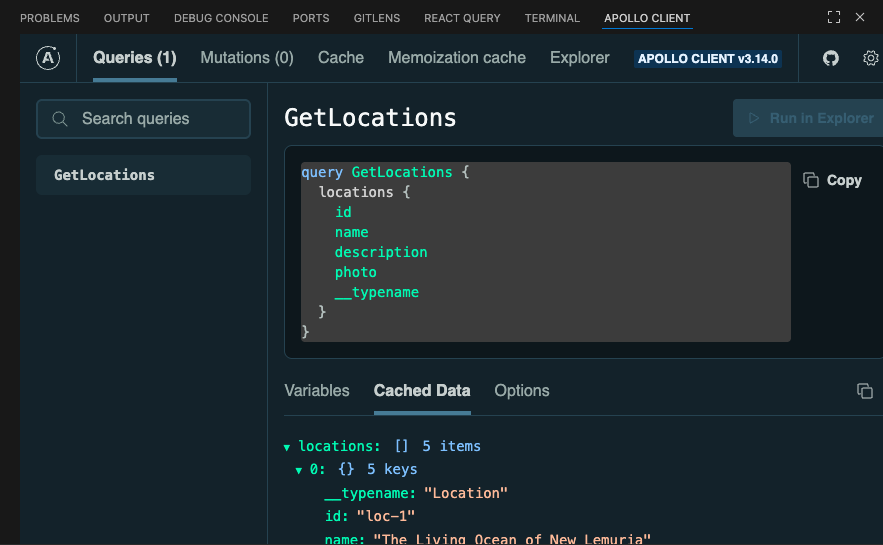
Apollo Client
This plugin doesn't require any additional configuration. When your application first loads the Apollo Client, the plugin should appear in the Dev Tools menu. Once enabled, the official Apollo Client Devtools will be attached to your application and allow you to inspect your Apollo Client usage in the editor's panel:
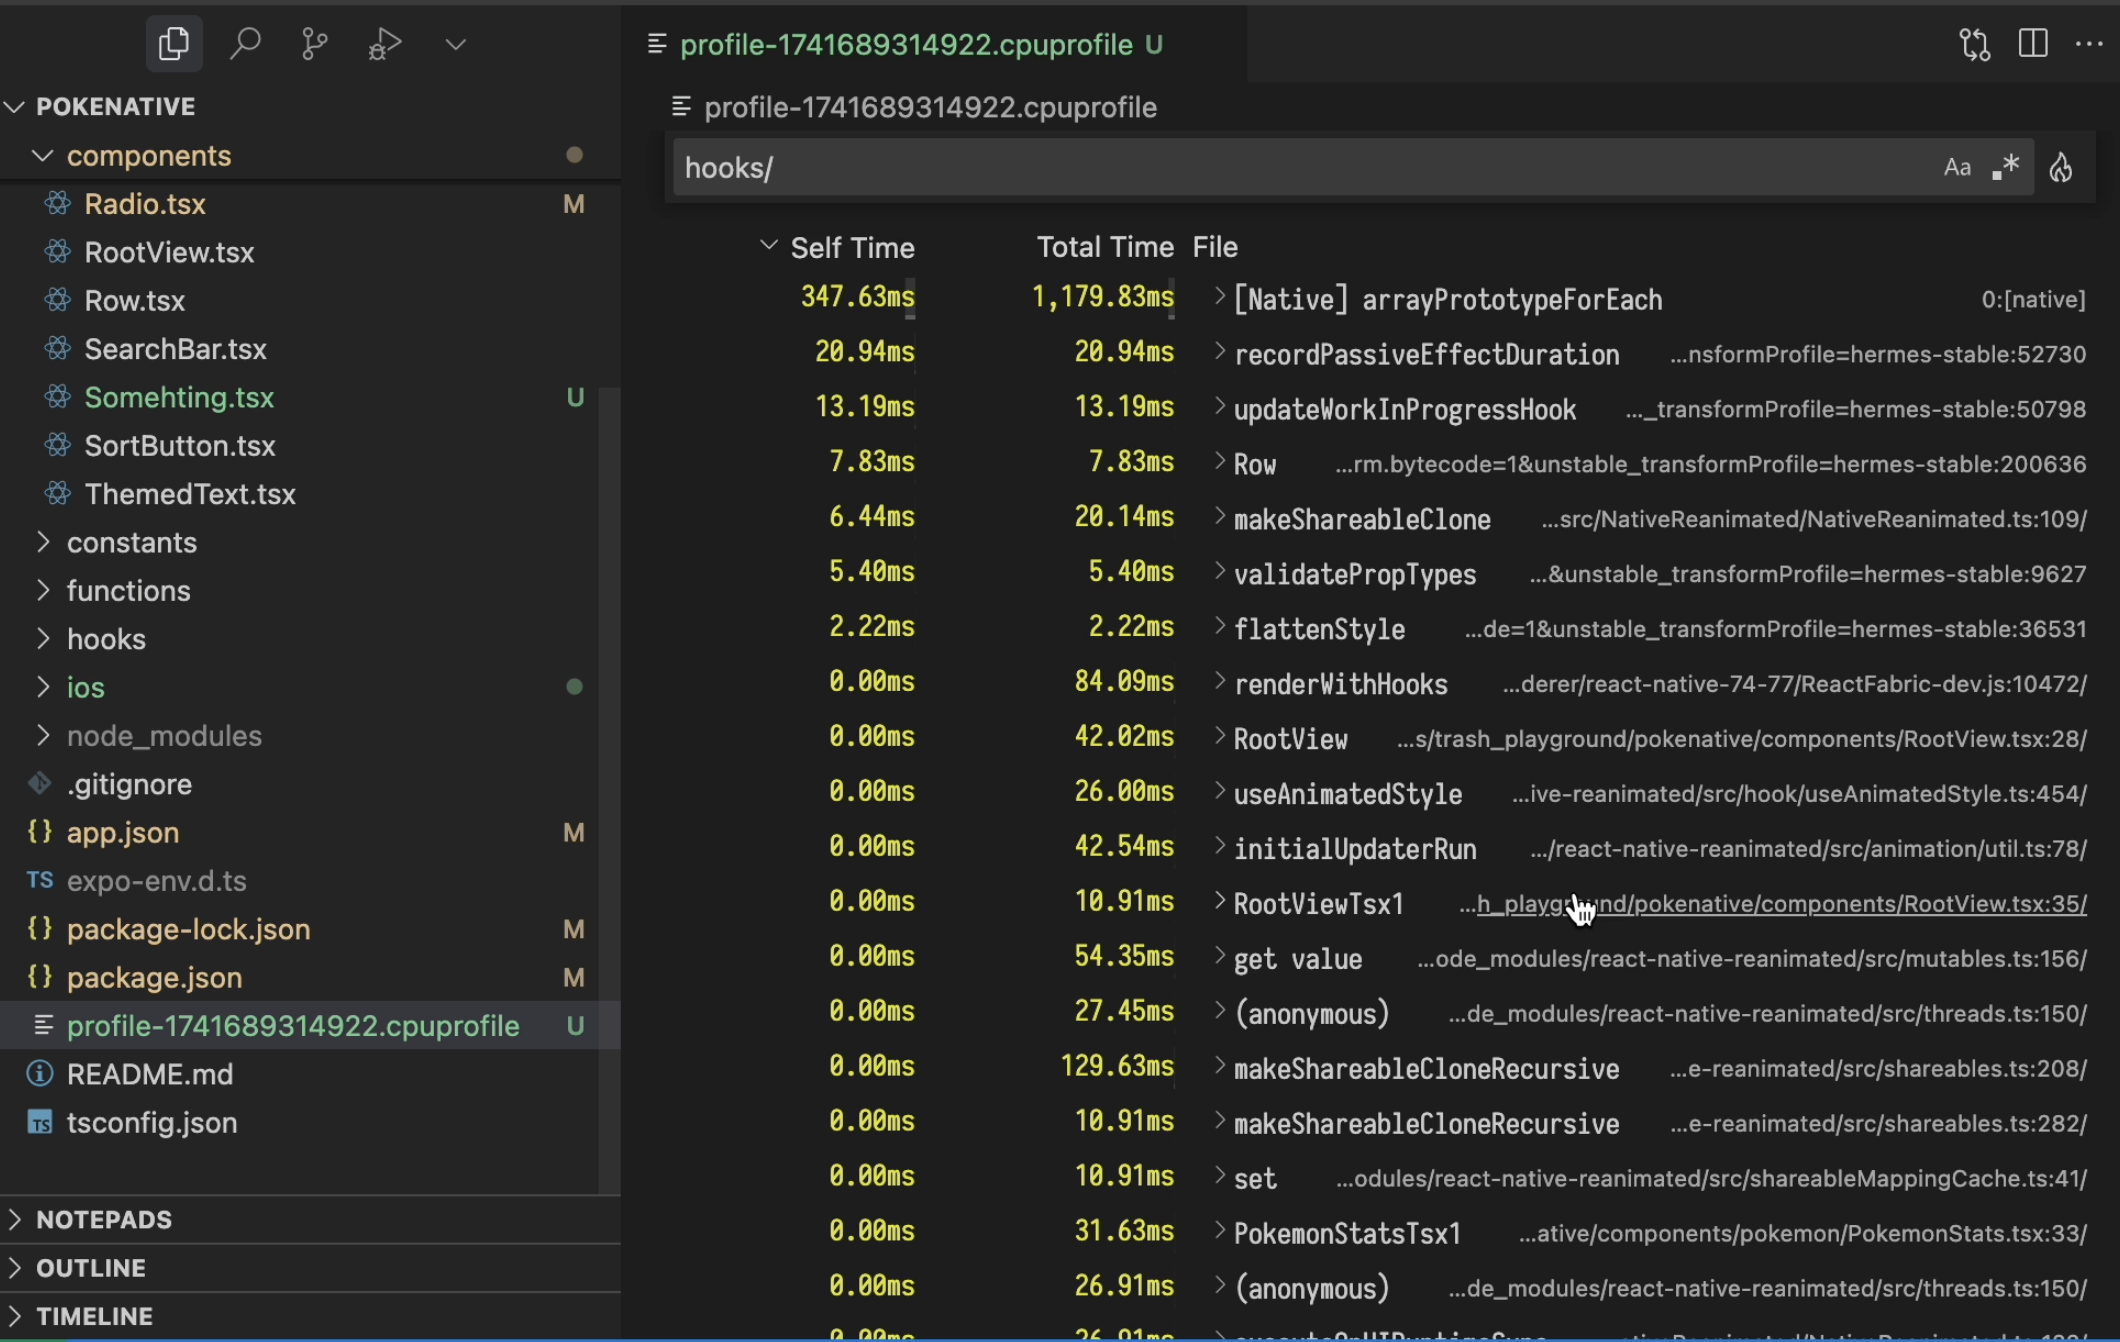
CPU Profiling JavaScript
Radon IDE integrates with the hermes sampling CPU profiler. When you app uses the supported version of hermes and devtools, the option to start profiling will appear in the Dev Tools menu. Once profiling is started a button will appear next to the navigation bar in the IDE indicating the profiling is in progress. You can use the button at the end of the profiling session to trigger a save dialog of the profiling output. Once you save the profiling file, the IDE will automatically open the saved profile and use the built-in Profile Visualizer plugin to display a profile.

When the profile is saved, Radon IDE resolves the source location of the methods captured during profiling session such that you can navigate to the code directly from the profile visualizer tool.
NOTE: In order to view the profile in flame chart view, you need to install official Flame Chart Visualizer extension. Once the profile is saved, Radon IDE will display a message with direct installation link for this extension.
When profiling, remember that the app you profile is the development build of your application running in a simulator environment. Development builds typically come with a significant overhead of extra work that is only done to provide better error reporting and traceability of errors. Hence the performance may significantly differ compared to the production builds running on an actual phone.
React Profiler
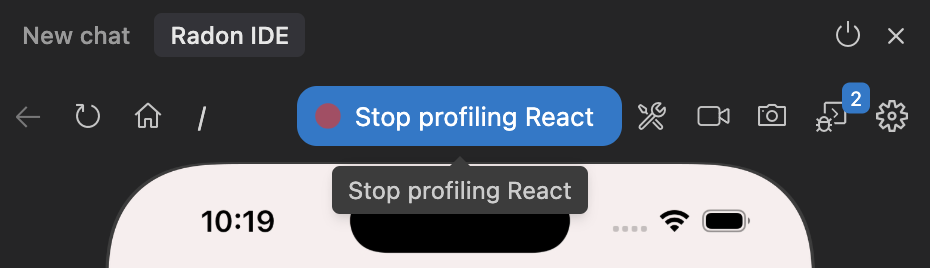
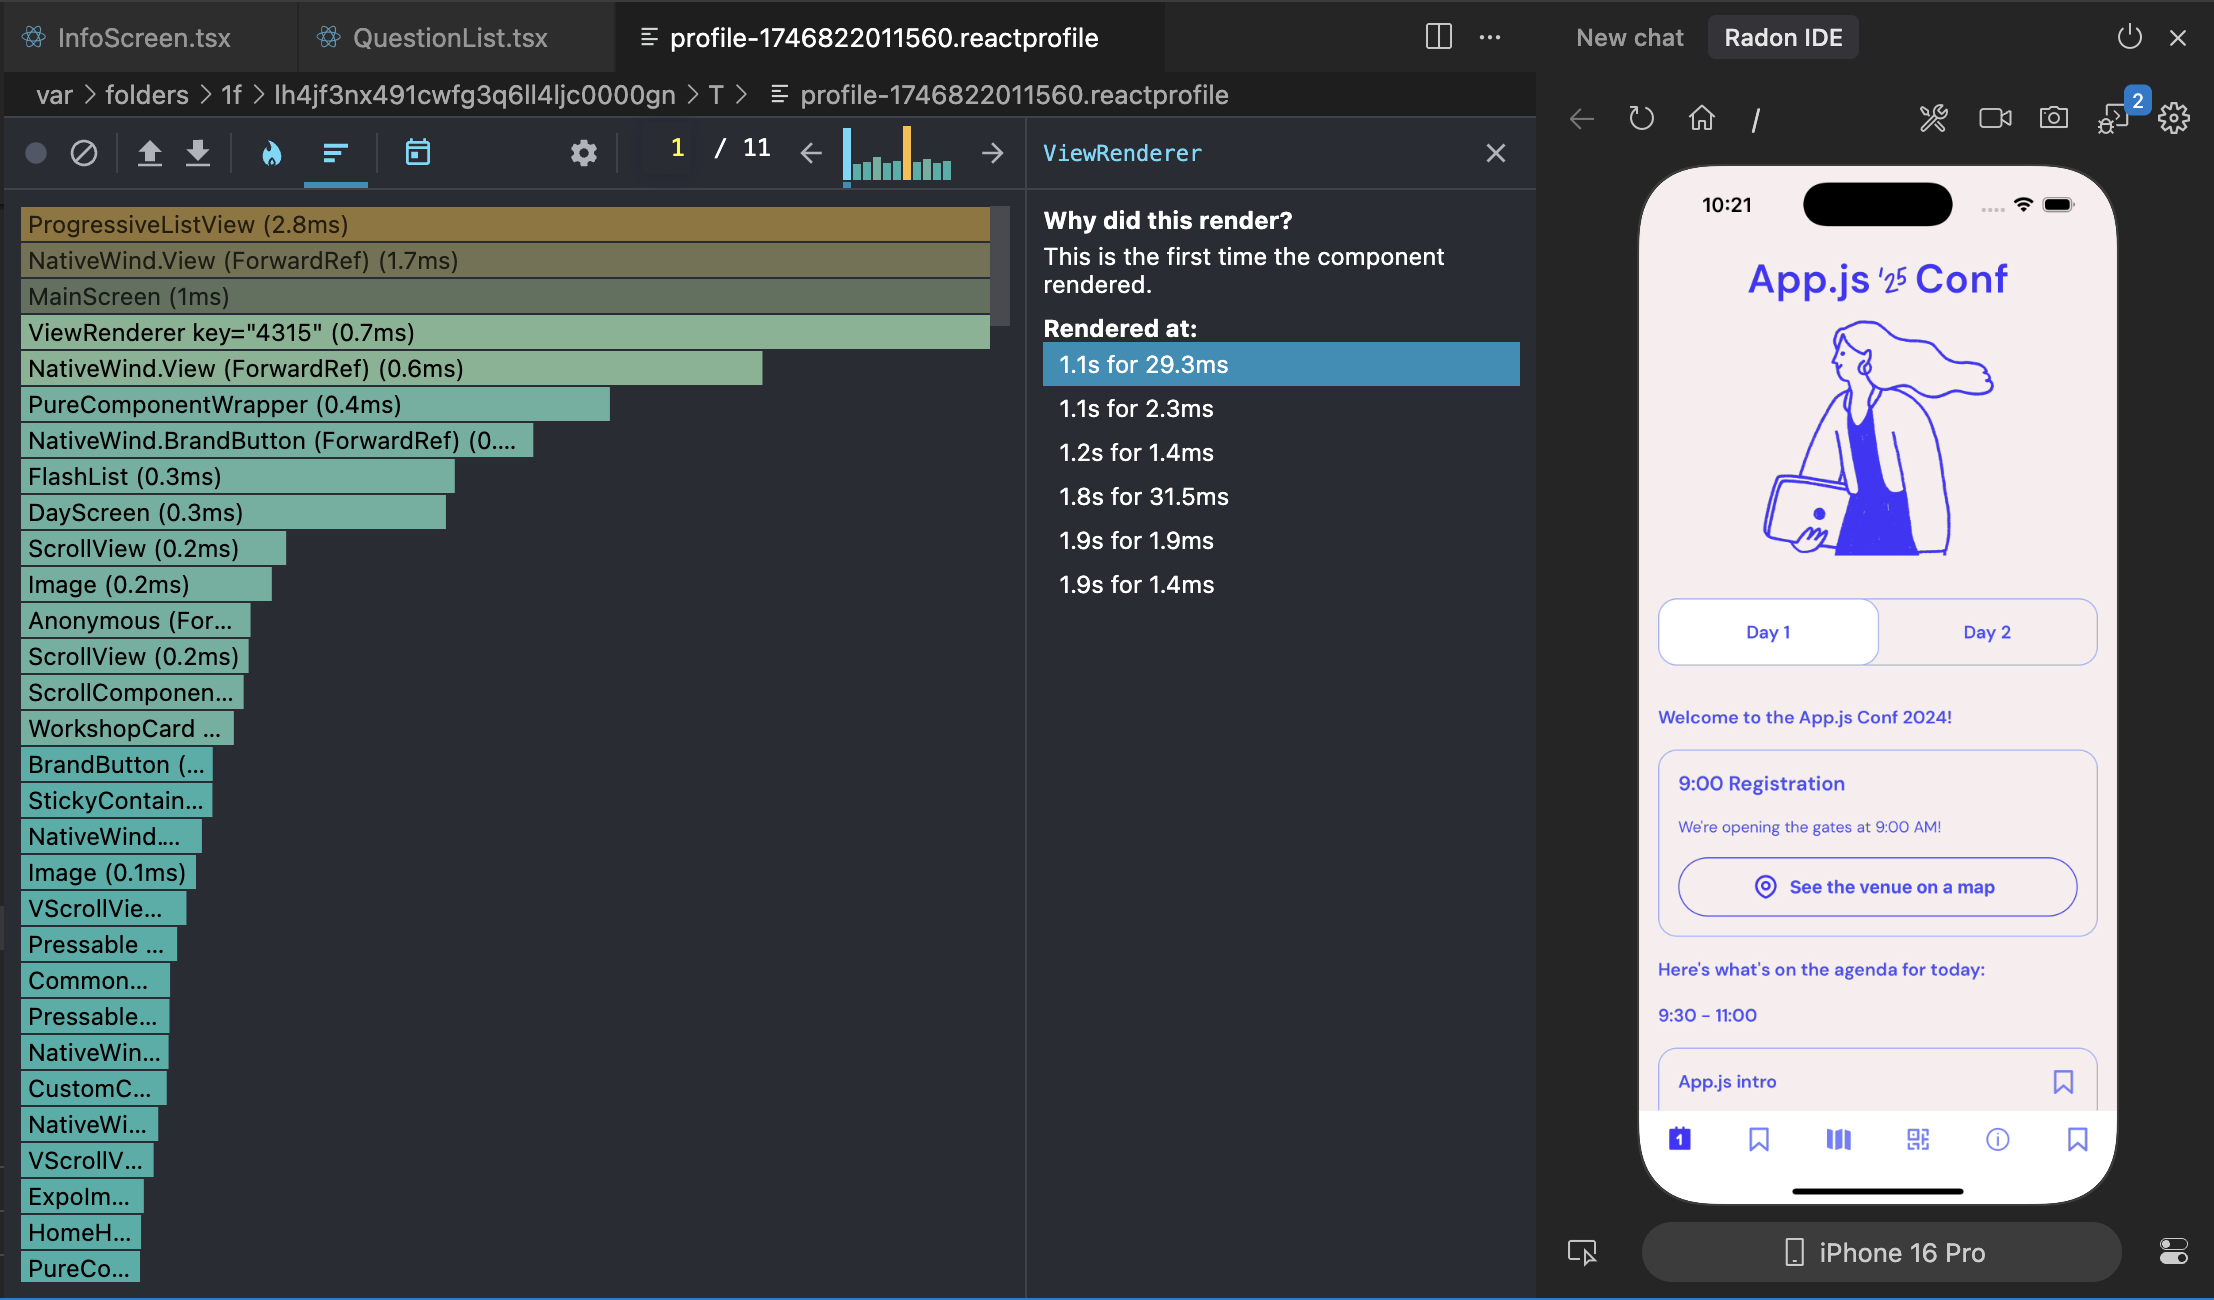
The React Profiler integration allows you to start and stop React Devtools profiler, and also to preview and analyze collected profile without leaving the comfort of your editor. You can start the React Profiler from the tools menu, similarily to how you start the CPU profiler. Once you are finished with your profiling session, you can stop the profiler using the active profile indicator that shows up over the device view when the profiler is active, or you can use the "Stop React Profile button from the tools menu:
Once the profile is stopped, Radon saves the profile into a temporary location under .reactprofile extension, and presents a new editor that uses the React Devtools UI to render the profile analysis tool:
Outline Renders (react-scan)
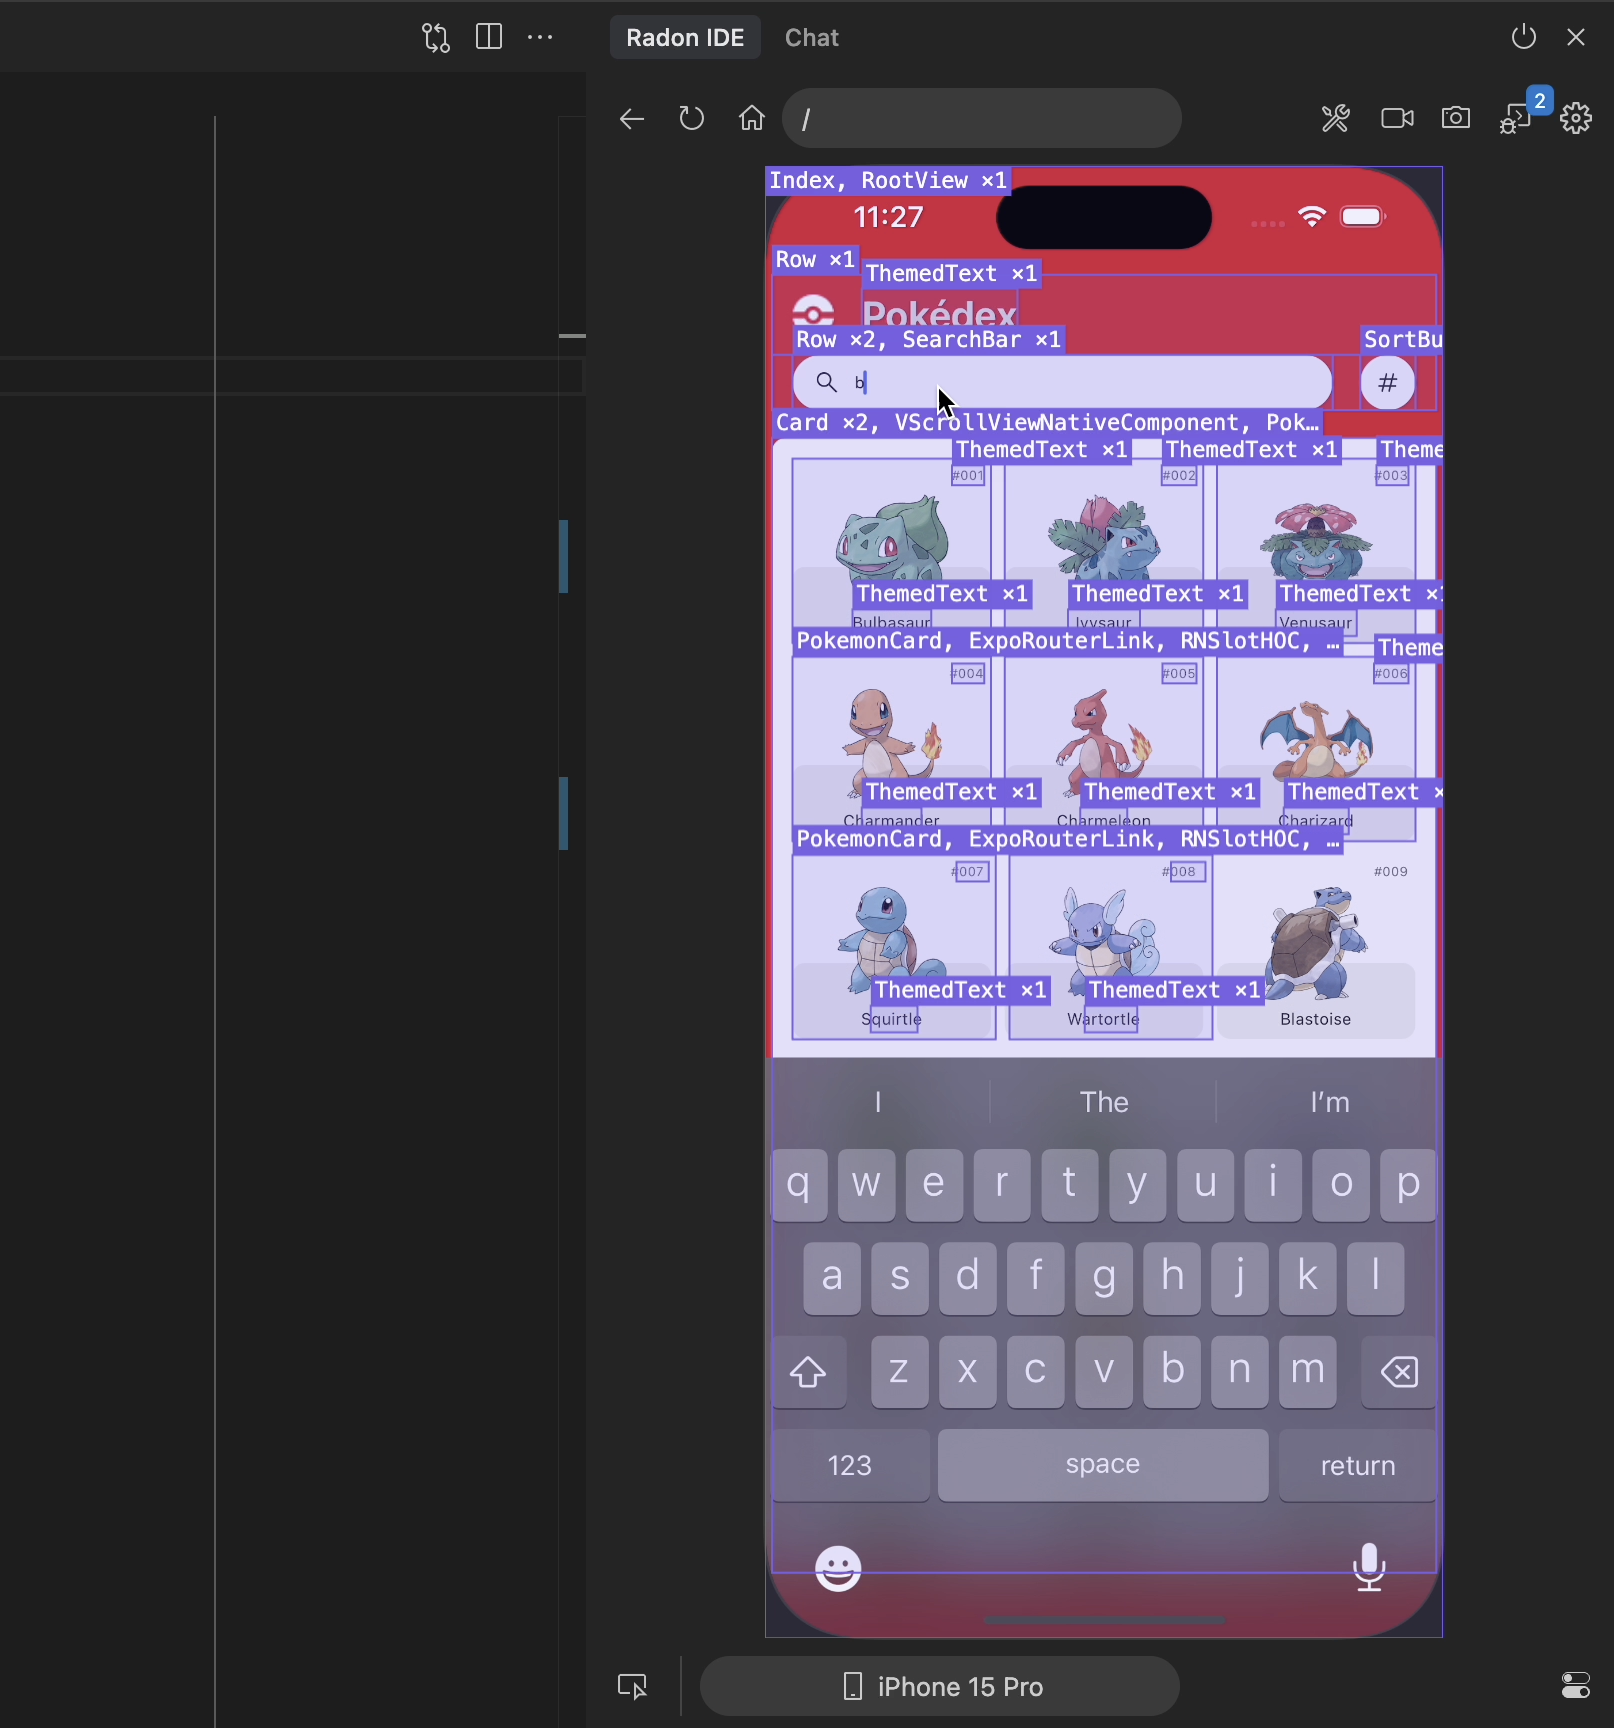
Radon IDE integrates with react-scan and enables a subset of its functionality. For now, only the visualization of React renders is integrated. You can enable this option by selecting "Outline Renders" from the Dev Tools menu. Once enabled, the IDE will visualize React renders happening within the app.
NOTE: Unlike with other dev tools, this setting turns off automatically when you close the editor or the Radon IDE panel.
Redux (via Expo Devtools Plugin)
We recommend you use the built-in Redux dev tool as described in the above section which requires no extra setup. However, if your workflow relies on using Expo CLI and you need to have the Expo Redux Devtool Plugin setup in your project, Radon IDE will automatically detect it and will use the Redux devtools via the installed plugin.
More tools
We are constantly working on adding more tools to Radon IDE. If there are existing tools that you find particularily useful, please open an issue to let us know.