Changelog
Inspected components & JS logs in chat context, Network Inspector improvements, React Native 0.83
- Add inspected components to chat context: Press the
Reference in chatto attach the selected component and its parent to the chat context.
-
view_application_logstool improvement: Radon AI can reference your JavaScriptconsole.logs in the chat context. -
Network Inspector improvements: Radon can now intercept network requests made with
react-native-fetch-api. This version also comes with support for the new network inspector implementation added in React Native 0.83. -
React Native 0.83 Support
-
Radon Enterprise customers can now remotely disable features.
-
Fixes to device management, URL bar, and license activation.
Physical Android Devices, Apollo Client DevTools, Radon Pro & Team Plans
- Physical Android Devices: Connect, build & run your application on physical Android devices.
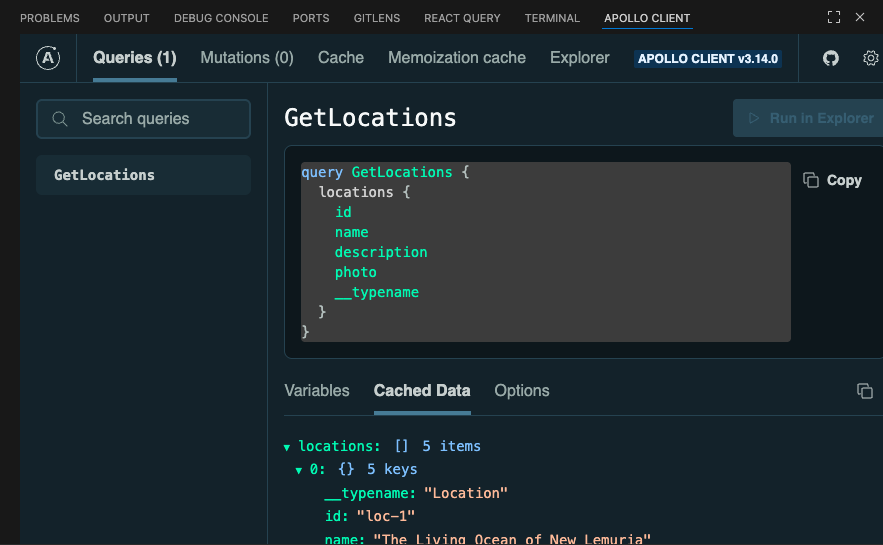
- Apollo Client DevTools: Inspect Apollo Client logs via built-in Apollo Client DevTools panel.
-
view_component_treetool: Radon AI can now request to view the currently mounted React component tree of your application. -
Lots of improvements to the Network Inspector, Redux DevTools, React Query DevTools, and Radon AI.
-
Introduced a Radon Free license. See the all the available features in the Free plan here.
Network Inspector Improvements, Logs Access for Radon AI, React Native 0.82
-
view_application_logstool: Radon AI can now see build and bundle logs from your application. -
Improved Network Inspector: Added Response tab syntax highlighting, different request & response copy options including to
cURLandfetch.
-
Support for React Native 0.82.
-
Added device support for iPhone Air and iPhone 17 Pro.
-
You can now run Radon with a single Metro server on a specific port.
-
More stability improvements and bug fixes.
Device Files Transfer, Improved Network Inspector, Expo SDK 54
- Device File Transfer: You can now send files to device.
- Improved Network Inspector: Added support for extended request filtering and sorting alongside various other UX improvements. Improved performance when dealing with a large number of requests.

-
Expo SDK 54 support
-
Added "Step Into"/"Step Out" controls to the debugger overlay.
-
Expo Prebuild can now be configured to run before building the application.
-
Replay overlay can now be controlled with the keyboard.
-
Fixes related to application building, launching and environment variables handling.
Rotation, Audio, Reading .env files & React Native 0.81 support
- Device Rotation: You can now rotate devices within the Radon IDE Panel.
-
Device Audio: Hear audio coming from the device and adjust the volume.
-
Environment variables from .env files: Radon IDE now understands the
.envfiles and appends the environment variables to the project setup. -
iPad support: Added iPad to the list of available devices.
-
Support for React Native 0.81
-
Improved debugger, element inspector and the Radon AI MCP integration
Radon Connect, Multiple launch configurations, Camera output on Android
- Radon Connect: Attach debugger to physical devices and external simulators.
-
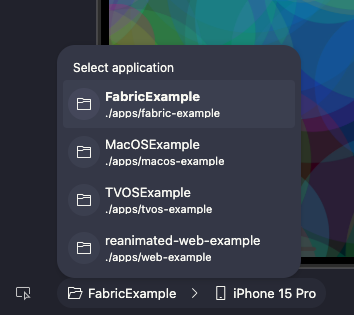
Multiple launch configurations: You can now quickly edit and switch between different project configurations from the App Root select.
-
Emulate camera output on Android
-
Moved
Open IDE Panelbutton from toolbar to the editor's status bar. -
Lots of fixes and improvements
Background devices, MCP integration for Radon AI, and React Native 0.80 support
- Run devices in background: Now, when switching between devices, Radon IDE will no longer terminate the previous device. This allows you to quickly switch between Android and iOS. You can turn off this behavior in Manage Devices window, or you can terminate active devices directly from the devices dropdown.
-
MCP integration for VSCode and Cursor: You can now use Radon AI in both VScode and Cursor's "Agent mode". In 1.8 Radon AI ships with additional tools for querying our react native docs database but can also capture device screenshots to help the agent debug or make UI adjustments (note that the image features currently work only with Gemini and Claude models)
-
React Native 0.80 support: This version supports the most recent release of React Native.
-
Lots of bug fixes
Improved Router Integration, App Root Selector in Preview
- Improved Router Integration: Now lists all available routes in the project and lets you type in the exact route you want to visit.
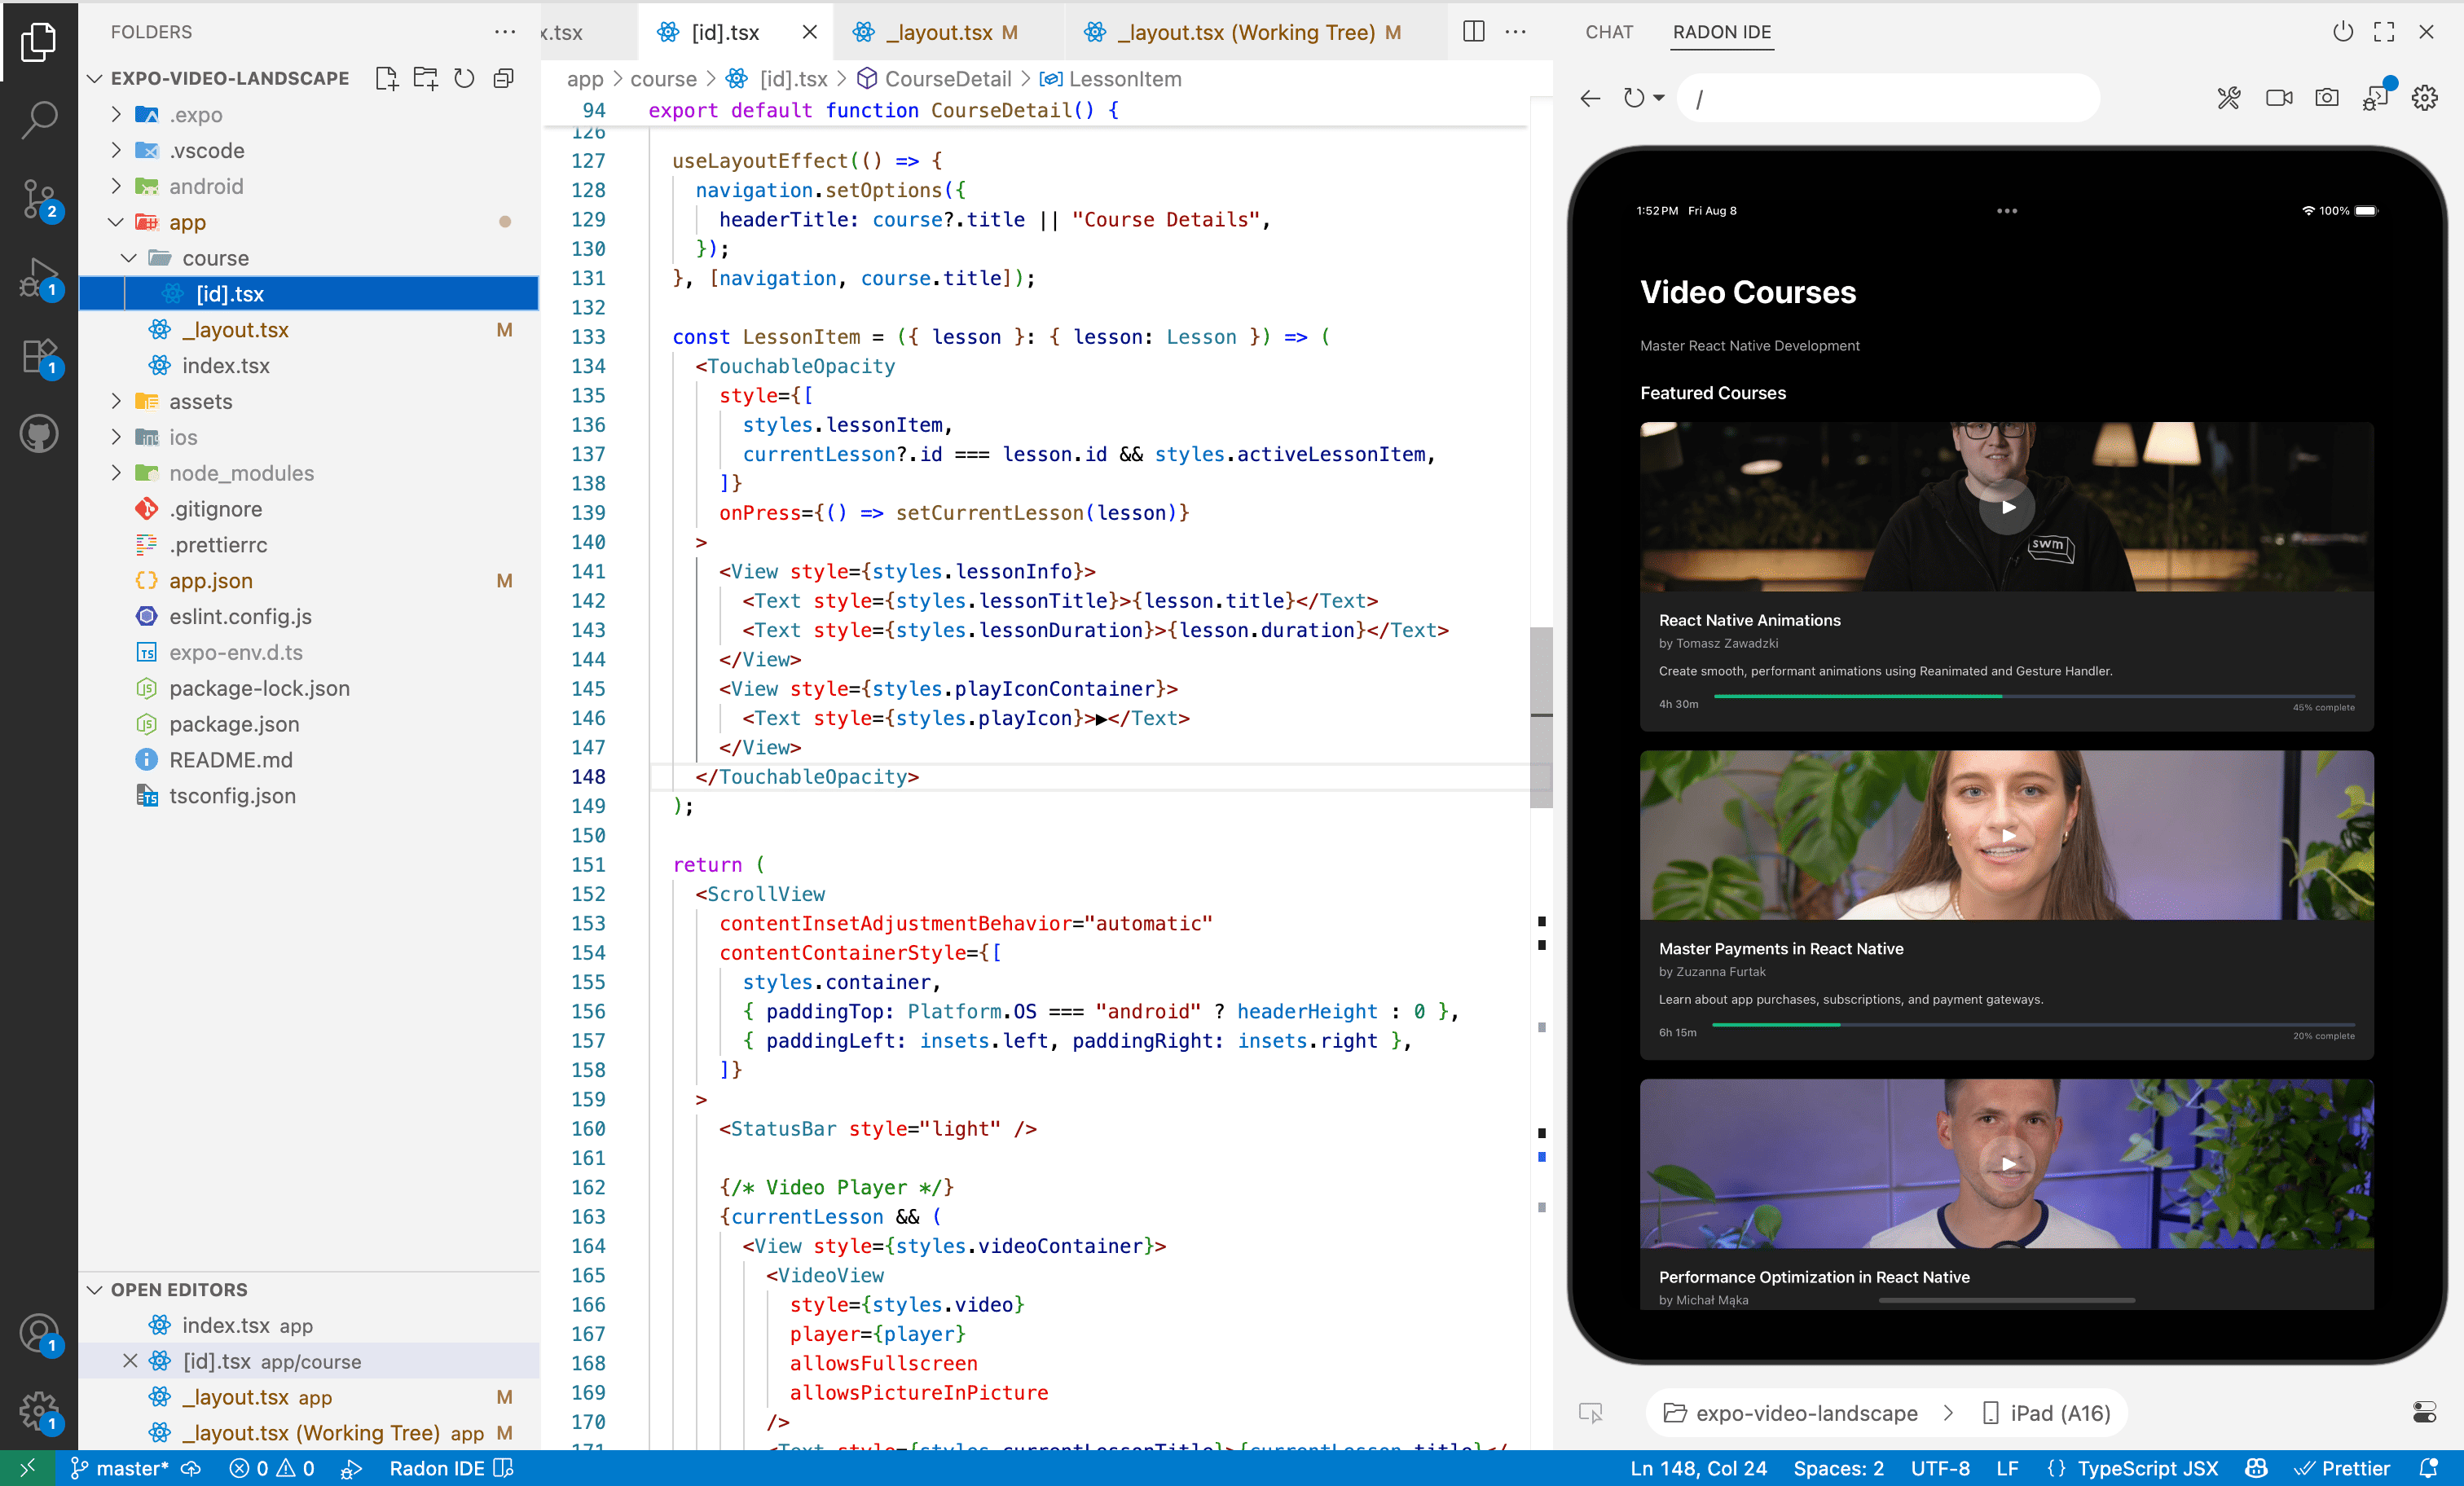
- Select App Root in Preview: You can easily switch between applications in a monorepo setup well as see at a glance which app root is selected.
-
Significant improvements to window management, build & run applications, debugger, and more informative build error messages.
-
Lots of UI/UX improvements.
React Profiler, RN 79 & Expo 53 support
- React Profiler: You can now capture React Profiles and preview them from within your editor. Try out React Devtools Profiler from the tools dropdown.
-
More JS debugger features: For apps that use the new React Native debugger, it is now possible to use conditional / expression breakpoints as well as use uncaught / caught exception filters. To add condition / expression to a breakpoint you can right-click on the breakpoint that is set next to the line in your code, and select "edit breakpoint" option from the context menu.
-
React Native 0.79, Expo 53 support: You can now use the latest versions of React Native and Expo with Radon IDE.
-
Expo Router v5 support: the URL bar integration now works with the recently released Expo Router v5.
-
EAS integration now support local EAS builds.
-
A number of bug fixes and stability improvements.
Radon AI
- Radon AI Chat: a GitHub Copilot Chat participant enhanced with up-to-date information about the React Native ecosystem. At the heart of it is our extensive React Native knowledge database, which is queried before answering your question.
-
Improved EAS workflows: Radon IDE will now display clearer build error messages and only download compatible builds from EAS by default.
-
Home / App Switch buttons support: Added options in the device settings menu that can trigger Home and AppSwitch button presses on the active device.
-
Improved bundle error & exception handling, including a stack trace with links to source files
-
Support for React Native 0.79
Zero-config React Query devtools, Outline Renders
- Outline Renders: a react-scan feature that helps you visualize React renders happening within the app.
- No setup React Query devtools: React Query devtools now doesn't require any additional configuration. If your app uses React Query you can investigate queries, modify data from the store, etc,
- JavaScript sampling profiler: Radon IDE integrates with the hermes sampling CPU profiler. Once you save the profiling file, the IDE will automatically open the saved profile and use the built-in Profile Visualizer plugin to display a profile.
- Tons of stability improvements
Network Inspector, Redux DevTools
- Built-in Network Inspector: Network panel captures and lists all requests triggered by the JavaScript code (with HXR / fetch or wrappers like Axios/Apollo etc). Images or websocket connections aren't currently supported and won't show up.
-
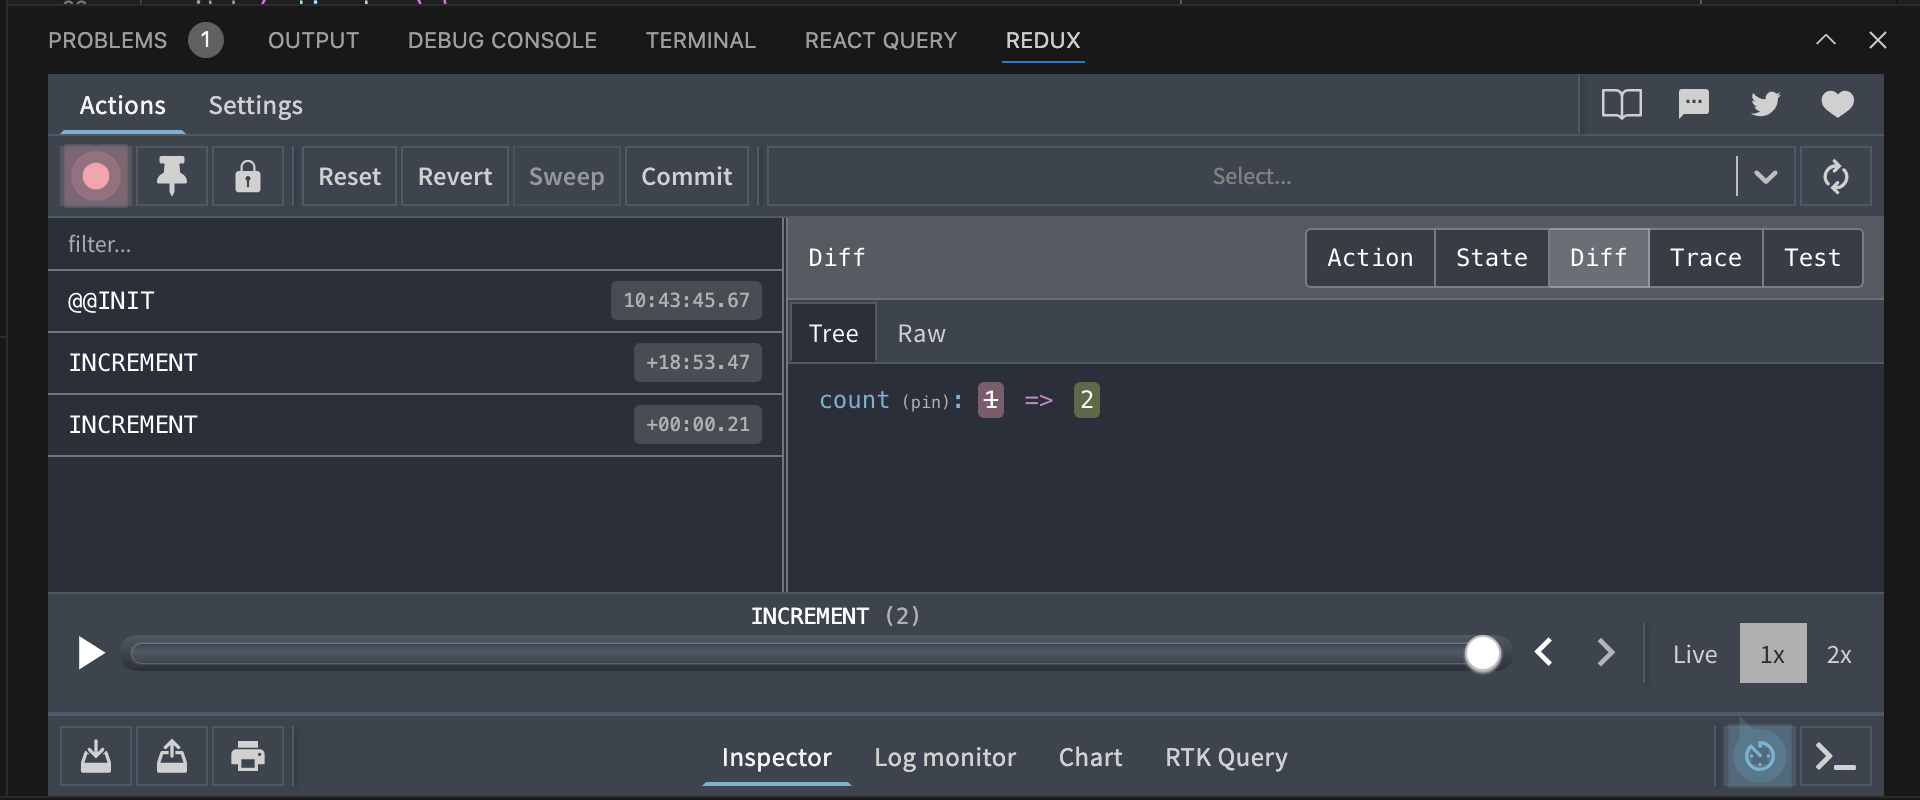
First-party Redux DevTools integration: If your app uses Redux Toolkit, the IDE will automatically detect that, and Redux plugin will be listed in the Dev Tools menu where you can enable it. Once enabled you will be able to use the official Redux UI from within your editor panel.
-
The panel now matches editor theme by default
-
Support for React Native 0.78
Redux and React Query DevTools
- Redux and React Query tools: An experimental support for launching Dev Tools as separate panels withing VSCode or Cursor via Expo Devtools Plugins. When the IDE detects that a certain tool is available and configured properly, it will be listed in the tools menu where you can turn it on and off. Follow the setup instructions from React Query Expo Devtool Plugin and Redux Devtool Plugin guides.
-
Support for eas build --local: Radon IDE can now build your apps using EAS Build with --local flag. This can be configured using the `customBuild` in `launch.json` file.
-
Support for React Native 0.77
-
UI updates making more room for device
-
More stability improvements and bug fixes
PNPM monorepos, console upgrades, and more
-
Console upgrades: log grouping, object previews, long data handling
-
Experimental Linux support
-
Support for PNPM monorepos
-
Better log-to-source links
Radon IDE 1.0 is live! 🎉
-
Element inspector: lets you quickly jump from the device preview to the exact line of code where given component is defined.
-
Debugging and logging: Breakpoints work in VSCode without any additional setup for React Native and Expo projects. The links displayed in the console are automatically linking back to your source code.
-
Router integration: Jump around the navigation structure supporting both Expo Router and React Navigation projects.
-
Previews: Develop components in isolation.
-
Storybook integration: The IDE automatically detects Storybook stories and provides a quick access to run them in the device preview.
-
Device settings: Adjust various device settings right from VSCode.
-
Instant replays: Rewinds the last 5, 10, 30 seconds of what was happening on the device.
-
And many more...