Network Inspector
Radon IDE comes with a Network Inspector panel allowing you to inspect network traffic. The tool will capture and list all requests of fetch and XMLHttpRequest triggered by the JavaScript code. The panel works for both React Native CLI and Expo applications.
Images or websocket connections aren't currently supported and won't show up.
Enabling the Network Inspector
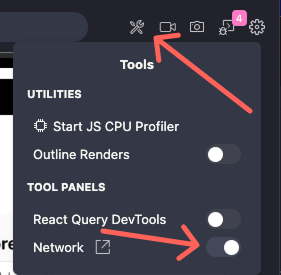
To enable the Network Inspector tab, first click the Tools button located on the top-right corner of the IDE. Then, enable the toggle next to the Network label. A new Network tab will appear in your editor.
If you hide the Network panel, you can reopen it by using the Link icon next to the Network label.
Using the Network Inspector
You can access the Network tab from IDE by clicking the Link icon next to the Network label in the Tools menu.
You can customize the Network Inspector behaviour using the following buttons:
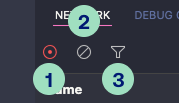
- Toggle network activity recording - starts or stops the capture of network requests made by your application.
- Clear network log - erases all currently displayed network requests displayed in a list.
- Filter domains - opens input field allowing for filtering the displayed logs.
Filtering and sorting
Clicking on the Filter button opens an input field where you can define filters for the logs displayed. Alongside the field, an Invert toggle allows to reverse the filter criteria.

- Apply filters globally across all columns by entering plain-text.
- Apply filters to specified columns using the syntax
column:valuefor simple filters, orcolumn:"value with spaces"for values that include spaces.
Hovering over a column header also displays a filter icon. Clicking it inserts a filter template directly into the filter input field for you.
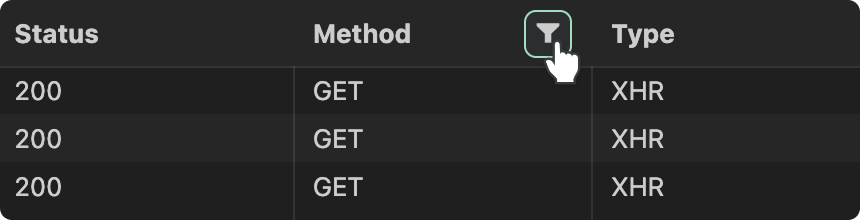
Clicking directly on a column header will additionally Sort the logs according to the values in that column.
Exploring network request details
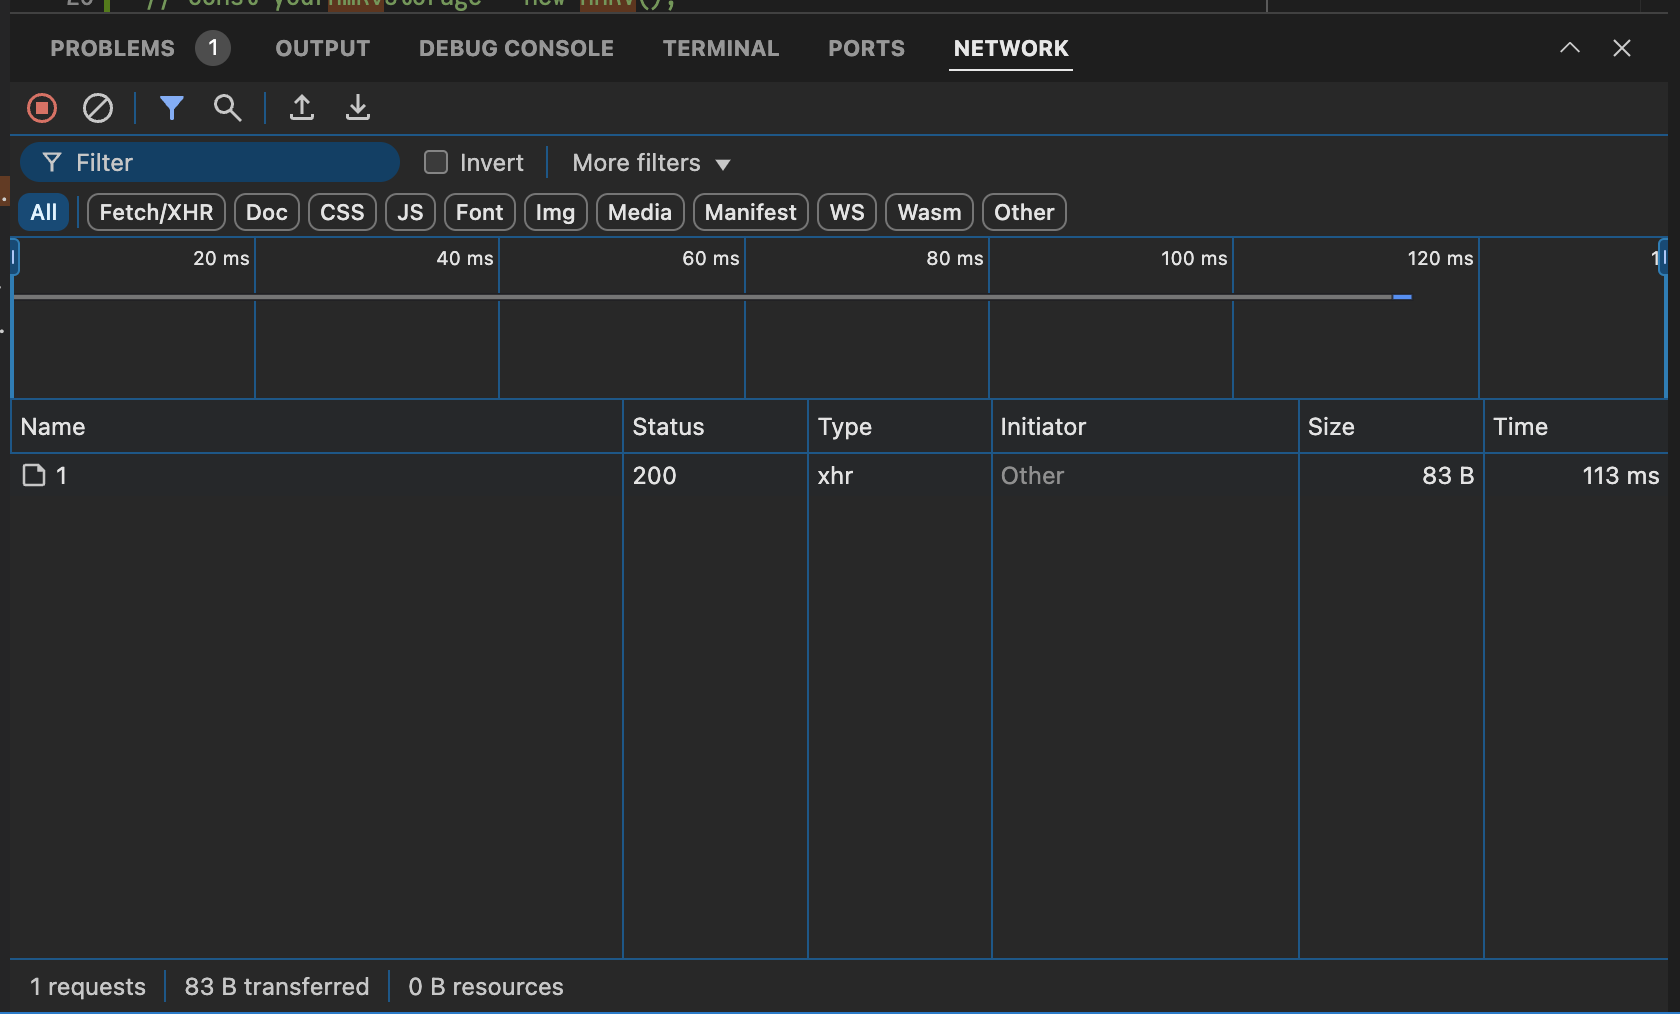
The Network Inspector displays a log of all network requests made by your application in a table. Each row represents a single request, and the columns provide key information about that request namely:
- Name - the segment of the path of the URL request.
- Status - a HTTP status code returned by the server.
- Method - a HTTP request method used (e.g. GET, POST, PUT, DELETE, etc.).
- Type - a MIME type of the requested resource. Currently, only
XHRtype is supported. - Size - the total size of the transferred resource.
- Time - the total duration of the request.
Clicking on the network log shows more details about the contents of the request. The details of the request are grouped into into Headers, Payload, Response, and Timing tabs.
Right clicking on the network log opens Context Menu, allowing for sorting and filtering the logs, copying the request details, refetching and opening responses in the editor's tab.