Troubleshooting
Troubleshooting issues with Radon IDE
When you encounter issues with using Radon IDE they usually are related to the local installation or problems that are specific to the project.
If you are trying to open Radon IDE on your existing project for the first time and it doesn't work, we first recommend testing Radon on some other project / possibly new app created with npx create-expo-app to help isolate potential issues with the installation on your computer.
Below, we outline some ways that may help you self-diagnose and hopefully resolve issues you may encounter when using the Radon IDE extension.
1. Project setup diagnostics commands
This command can be located on the vscode commands palette when a given workspace is not recognized as a valid React Native of Expo project. In this case lookup command called "Radon IDE: Diagnostics" – when executed it will show a notification message with pointers on why Radon IDE panel cannot be opened for this project.
2. Is your project setup supported?
The extension does not currently support all types and configurations of React Native projects. For example, brownfield apps aren't supported while we are improving the compatibility of different project setups. Please refer to Compatibility section for more details on that. If your project doesn't work out of the box because of some modifications made to its setup, chances are the Radon IDE can be configured to support your modifications, please check configuration guide to learn more.
3. Can extension locate your React Native project
The extension supports monorepo-type of setups and you should be able to use it even if the app isn't in the root folder of your workspace.
This setup however has some limitations because the extension can only work with a single application per workspace.
If your monorepo contain multiple projects, you'll need to instruct the extension with the location of your main React Native or Expo application folder.
This can be done using launch configuration using appRoot setting – please refer to configuration guide for more details.
4. List of available devices is empty
The extension relies on Android Studio to install Android emulators and on Xcode tools to manage and install iOS simulators. The extension can spawn new devices on its own, but it requires the system images to be installed using Android Studio and Xcode. Please refer to simulators section to learn more about installing system images for different platforms.
5. Stuck on "Waiting for app to load"
You typically should not see this state for longer than a second or two. If it stays visible longer than that, something might be wrong with the device setup and this type of issue indicates that the extension may be unable to launch and render your app automatically. When this happens, you can click on the "Waiting for app to load" text to reveal the device preview and see what's happening under the hood. Sometimes the app gets blocked by some system dialog that we don't have a way to detect, in which case you need to close the dialog and the app should start normally.
6. Accessing extension logs
In order to access Radon IDE extension logs you need to open "Output Panel" with the default shortcut ⇧⌘U or by using a command named "Developer: Show Logs..." from the command palette. On the "Output Panel", select "Radon IDE" as the source. In order to share the logs with others you can use "Open Output in Editor" option available from the Output Panel toolbar. In case of build failures or native crashes, see Accessing build logs or Accessing application process logs.
In pre-release versions, the extension is configured to do a lot of verbose logging despite a different log level you may have set in your vscode's settings. This is done so that we don't need to ask you to change the log level setting that applies to all the extensions and the editor itself. As a consequence you may see a lot of unnecessary messages in the log output, but we still believe it'd give us better signal when dealing with potential issues.
7. Accessing build logs
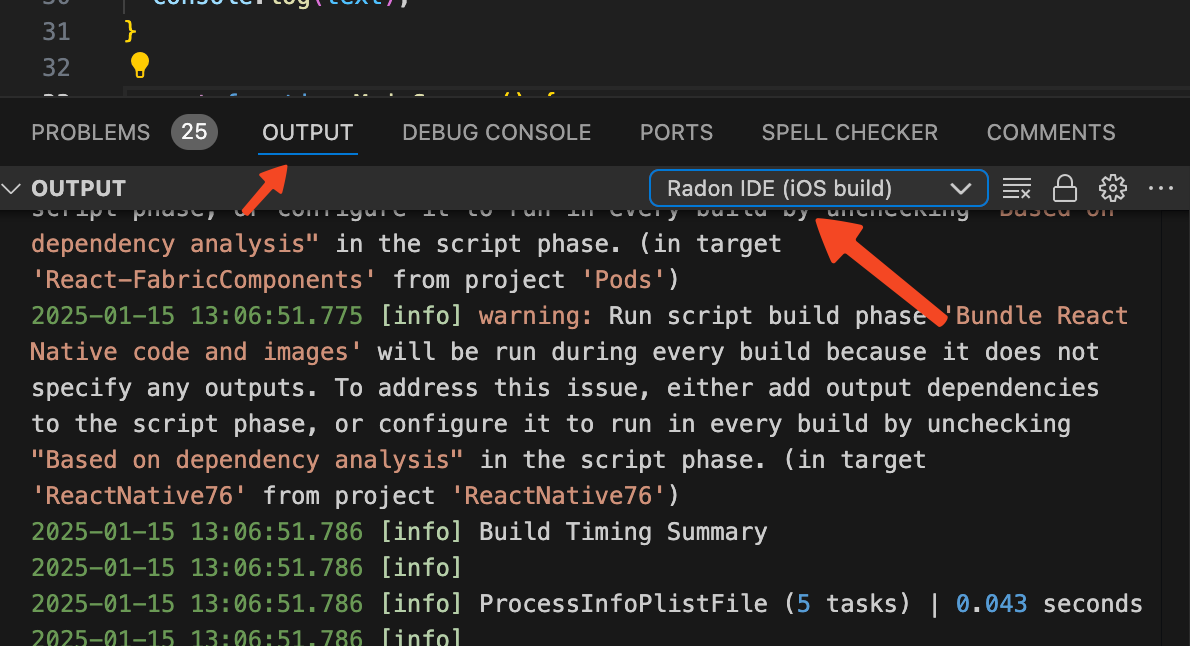
Native builds are one of the most time consuming phases when launching your project. Build processes output a lot of logs on their own and hence they have separate output channels. When something goes wrong in the native build phase, instead of checking "Radon IDE" source in "Output Panel" as described in the previous point, select "Radon IDE (Android build)" or "Radon IDE (iOS build)" source depending on the platform you're building for.

8. Accessing application process logs
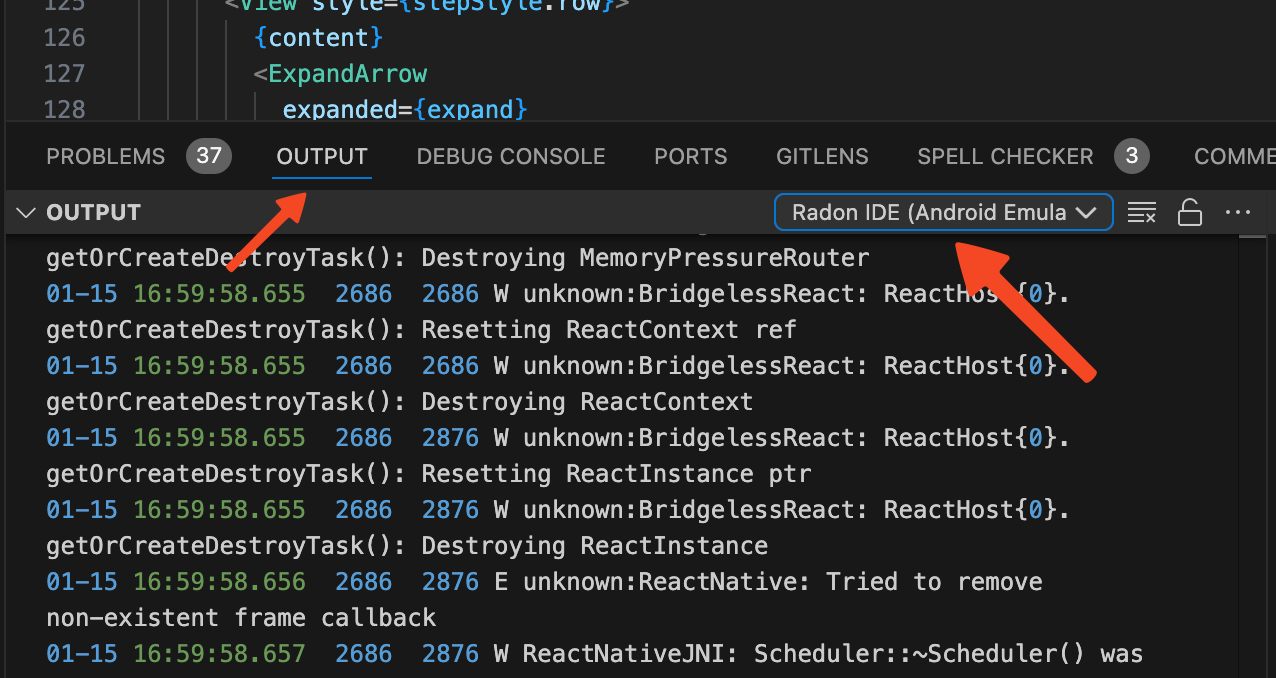
In cases of native crashes on iOS or Android, it may be helpful to investigate those by checking iOS process output, or Android logcat. When the application is launched, Radon IDE creates a separate output channel to record logs printed by the application process. In order to see it, you can go to "Output" panel and select "Radon IDE (iOS Simulator Logs)" for logs from your iOS application process or "Radon IDE (Android Emulator Logs)" to see android's logcat entries associated with your app.

Note: iOS Simulator Logs currently doesn't work on Expo Go and Expo Dev Client projects.
9. Fresh installation in VSCode / Cursor
There are two locations on the disk where Radon IDE stores its information.
- The installation directory is located under
~/.vscode/extensions/swmansion.radon-ide-*– with a suffix of current version + CPU architecture - Emulator and simulator instance storage is located under
~/Library/Caches/com.swmansion.radon-ideand~/Library/Caches/com.swmansion.radon-ide
If you'd like to perform a clean installation, you can delete both of those folders, restart VSCode and install the extension again from the marketplace.
10. General ways of recovering in case of errors
Here is what you can try when the extension got stuck on some errors:
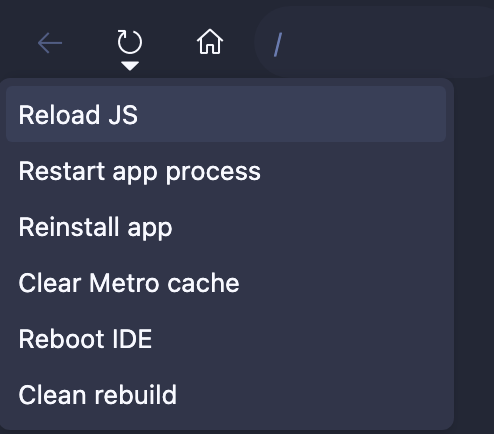
- Try using different ways of rebuilding the app – there are several options available under the menu that you can open by hovering the reload button:

- Specifically, "Clean rebuild" option will trigger a full clean rebuild of your project.
- Try closing and reopening extension panel
- Check whether you can build and run app without the extension (using
expoorreact-native-cli) - Try restarting vscode ¯\_(ツ)_/¯
11. Installing an older version of the IDE
If you need to install an older version of an IDE, you can do so by navigating to the cogwheel menu next to the "install" button in the market place.

12. Configuring Alternative Xcode Versions
If you are using alternative Xcode version ( e.g. xcode-beta, "xcodes" ios simulators will only work if xcode-select points to the correct directory to set it up run: xcode-select --switch ${PathToYourXCode}/Contents/Developer
13. IDE looks bad with my theme
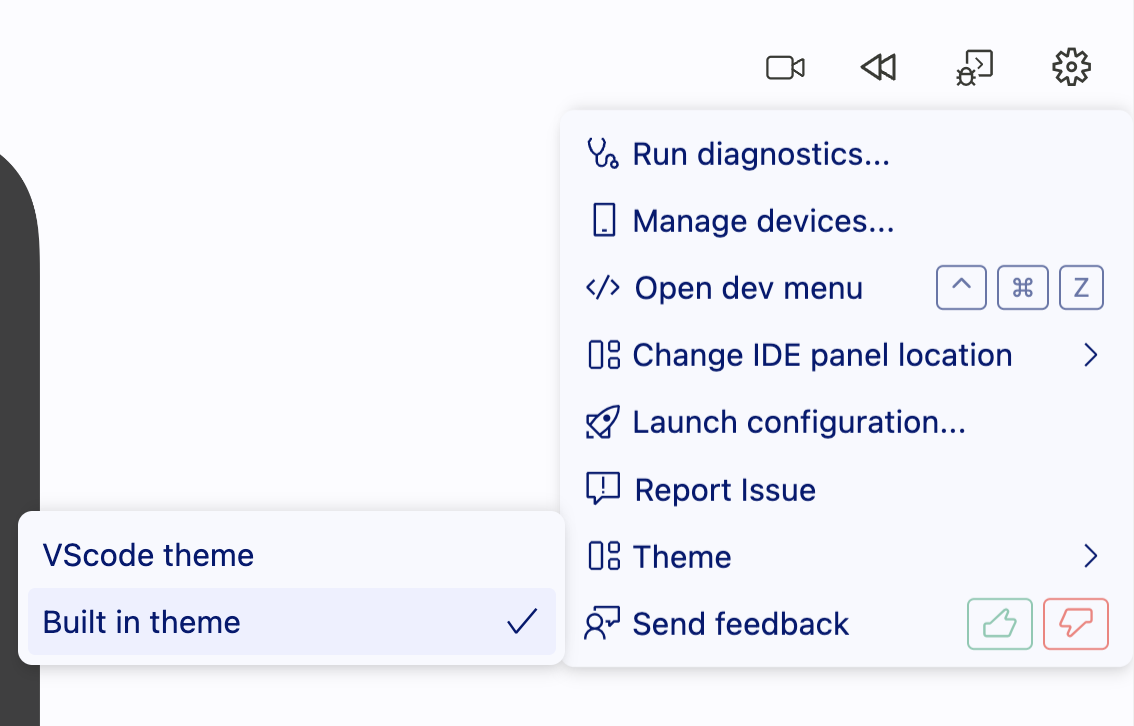
Radon IDE supports a wide range of themes, but it's not possible to support all of them. If you're using a theme that doesn't look good with Radon IDE, please open an issue on the Radon IDE GitHub repository and we'll try to fix it. Menawhile you can use built-in themes. Radon IDE comes with dedicated light and dark themes.

14. Node version is not supported
Radon IDE uses node version inherited from a shell run in the application root and checks if it satisfies react-native minimum requirements.
If you have a specific setup that uses node version from outside this range or you want to narrow down the scope of compatible versions for your internal needs, you can do so by specifying engines field of your application's package.json.
If you have a problem installing a compatible node version, we recommend using a tool like nvm.
15. Force-enable Element Inspector
Element Inspector is disabled by default in apps that don't support edge-to-edge mode due to inconsistent behavior. If needed, the tool can be activated regardless of these limitations using the RadonIDE.enableExperimentalElementInspector setting in your editor.
Note that while the tool will be operational, its behavior might be unpredictable.